![]()
Scenario analysis
We will perform scenario analysis. Regarding phase-dependent SIR-derived ODE models, this analysis focused on the impact of changes of ODE parameter values on the number of cases.
[1]:
from datetime import timedelta
import pandas as pd
import covsirphy as cs
cs.__version__
[1]:
'3.1.2.delta'
1. Create analyzer
An instance of ODEScenario() will be created here. We have two options as follows.
With dataset of recommended servers
With
pandas.DataFrameWith serialized ODEScenario object (JSON file, from version 2.28.0)
1.1 With dataset of recommended servers
We can create an instance with class method ODEScenario.auto_build() if the target dataset was registered in the recommended servers explained in [Data preparation]. As an example, we will use the dataset in Italy.
The following steps will be performed automatically and “Baseline” scenario will be registered.
Using DataEngineer class internally,
Data downloading
Data cleaning
Data transformation
Data subsetting
Data complement (if necessary and selected)
Using Dynamics class internally,
Time-series segmentation with S-R change point analysis
Tau estimation
ODE parameter estimation
[2]:
snr_act = cs.ODEScenario.auto_build(geo="Italy", model=cs.SIRFModel, complement=True)
2025-12-15 at 13:36:21 | INFO |
<SIR-F Model: parameter estimation>
2025-12-15 at 13:36:21 | INFO | Running optimization with 4 CPUs...
2025-12-15 at 13:38:25 | INFO | Completed optimization. Total: 2 min 4 sec
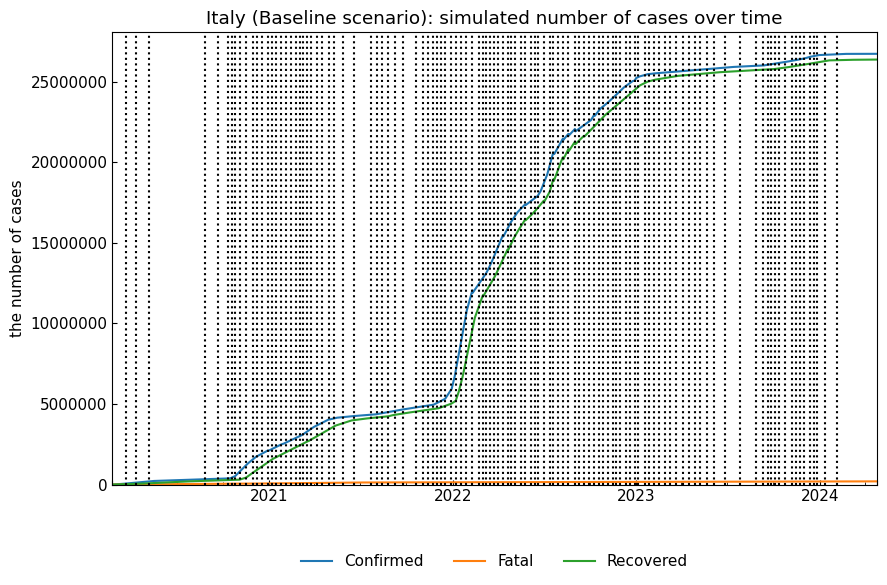
We can perform simulation with ODEScenario().simulate() directly.
[3]:
snr_act.simulate(name="Baseline");
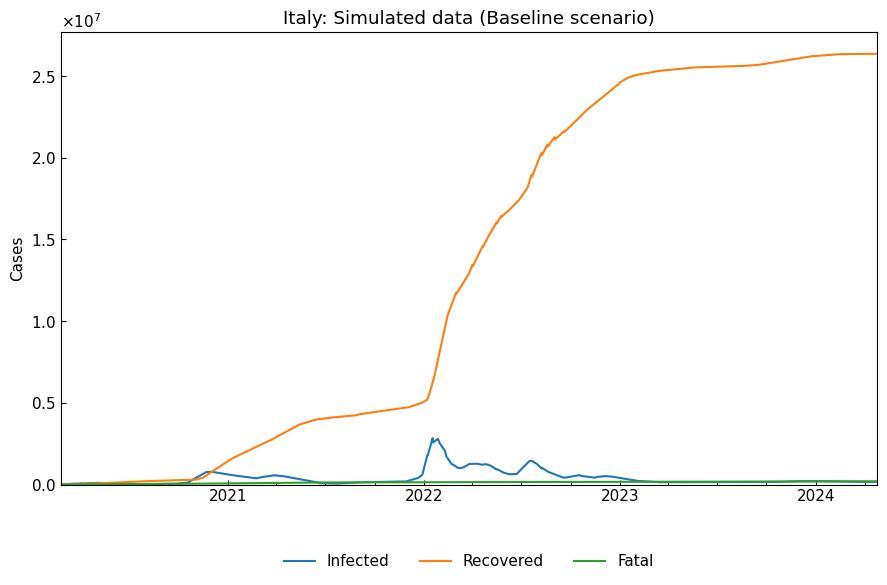
Or, we can confirm the dynamics of the baseline scenario, producing Dynamics instance.
[4]:
dyn_act = snr_act.to_dynamics(name="Baseline")
# Show summary
display(dyn_act.summary())
# Simulation
dyn_act_df = dyn_act.simulate(model_specific=False)
cs.line_plot(
    dyn_act_df.drop("Susceptible", axis=1), "Italy: Simulated data (Baseline scenario)")
| Start | End | Rt | theta | kappa | rho | sigma | alpha1 [-] | 1/alpha2 [day] | 1/beta [day] | 1/gamma [day] | |
|---|---|---|---|---|---|---|---|---|---|---|---|
| Phase | |||||||||||
| 0th | 2020-02-24 | 2020-03-22 | 6.67 | 0.027452 | 0.000643 | 0.017853 | 0.001959 | 0.027 | 104 | 4 | 34 |
| 1st | 2020-03-23 | 2020-04-10 | 2.73 | 0.03592 | 0.000576 | 0.004761 | 0.001106 | 0.036 | 116 | 14 | 60 |
| 2nd | 2020-04-11 | 2020-05-05 | 1.08 | 0.070798 | 0.000173 | 0.001824 | 0.001389 | 0.071 | 386 | 37 | 48 |
| 3rd | 2020-05-06 | 2020-08-28 | 0.29 | 0.124483 | 0.000082 | 0.000697 | 0.001994 | 0.124 | 816 | 96 | 33 |
| 4th | 2020-08-29 | 2020-09-25 | 2.83 | 0.000035 | 0.000019 | 0.002915 | 0.00101 | 0.0 | 3458 | 23 | 66 |
| ... | ... | ... | ... | ... | ... | ... | ... | ... | ... | ... | ... |
| 119th | 2024-07-18 | 2024-07-30 | 4.16 | 0.03354 | 0.000003 | 0.001545 | 0.000356 | 0.034 | 25833 | 43 | 187 |
| 120th | 2024-07-31 | 2024-08-15 | 2.86 | 0.000321 | 0.000007 | 0.001633 | 0.000565 | 0.0 | 10172 | 41 | 118 |
| 121st | 2024-08-16 | 2024-09-01 | 2.94 | 0.021414 | 0.000006 | 0.001173 | 0.000385 | 0.021 | 11484 | 57 | 173 |
| 122nd | 2024-09-02 | 2024-09-25 | 1.94 | 0.000082 | 0.000005 | 0.000725 | 0.000369 | 0.0 | 13201 | 92 | 181 |
| 123rd | 2024-09-26 | 2024-10-16 | 2.16 | 0.003887 | 0.000005 | 0.001365 | 0.000623 | 0.004 | 12474 | 49 | 107 |
124 rows × 11 columns
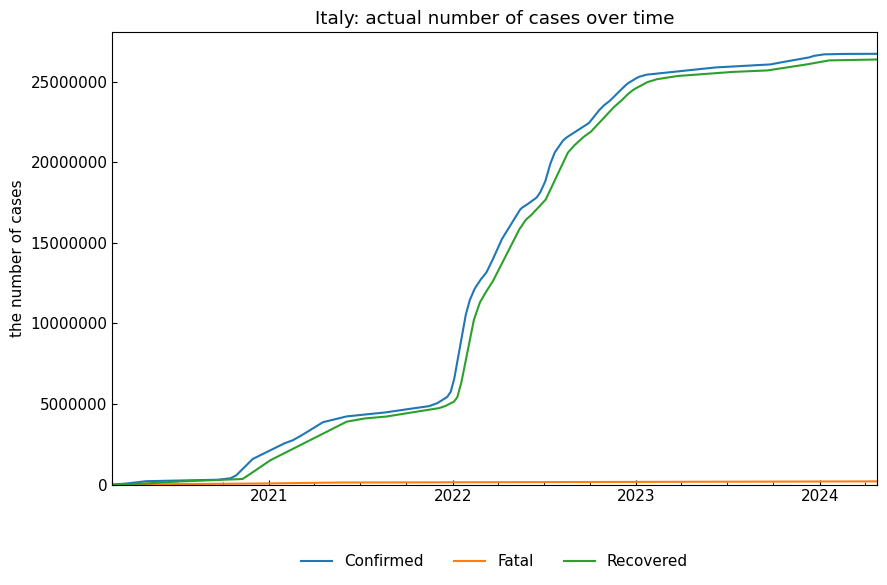
If name is not specified, actual records will be shown.
[5]:
snr_act.simulate();
1.2 With pandas.DataFrame
The following solution is useful when we want to use pandas.DataFrame or sample data for scenario analysis.
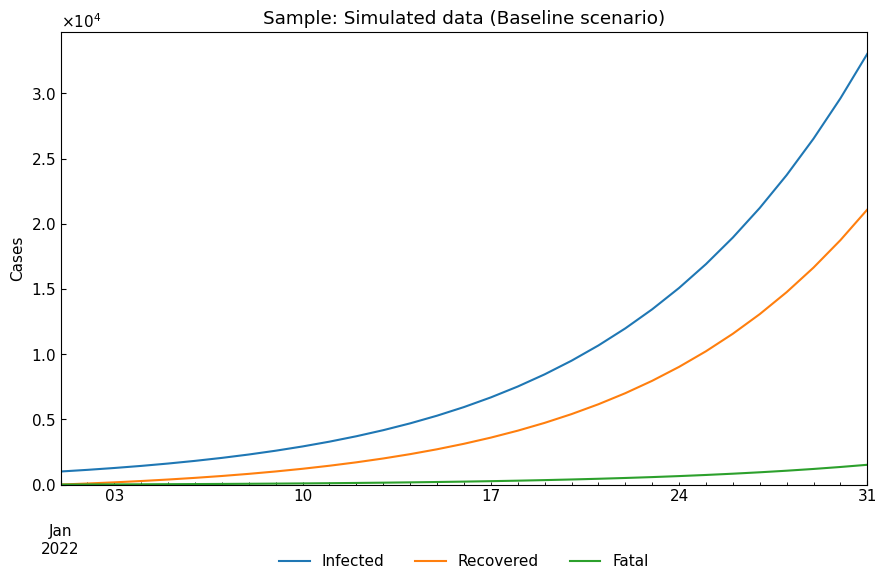
At first, we will prepare an instance of Dynamics.
[6]:
dyn_sample = cs.Dynamics.from_sample(cs.SIRFModel, date_range=("01Jan2022", "31Jan2022"), tau=1440)
sample_df = dyn_sample.simulate()
cs.line_plot(sample_df.drop("Susceptible", axis=1), "Sample: Simulated data (Baseline scenario)")
Then, prepare a pandas.DataFrame with time-index and Population/Confirmed/Recovered/Fatal columns. DataEngineer class will be useful.
[7]:
eng = cs.DataEngineer(layers=["Country"])
df = sample_df.reset_index()
df.insert(0, "Country", "Sample")
eng.register(data=df)
eng.inverse_transform()
subset_df, *_ = eng.subset(
    geo="Sample", variables=["Population", "Confirmed", "Recovered", "Fatal"]
)
display(subset_df.head())
display(subset_df.tail())
| Population | Confirmed | Recovered | Fatal | |
|---|---|---|---|---|
| Date | ||||
| 2022-01-01 | 1000000.0 | 1000 | 0 | 0 |
| 2022-01-02 | 1000001.0 | 1213 | 80 | 6 |
| 2022-01-03 | 1000000.0 | 1451 | 169 | 12 |
| 2022-01-04 | 999999.0 | 1720 | 271 | 19 |
| 2022-01-05 | 1000001.0 | 2025 | 385 | 28 |
| Population | Confirmed | Recovered | Fatal | |
|---|---|---|---|---|
| Date | ||||
| 2022-01-27 | 1000000.0 | 35218 | 13068 | 940 |
| 2022-01-28 | 1000001.0 | 39544 | 14753 | 1061 |
| 2022-01-29 | 1000000.0 | 44357 | 16637 | 1196 |
| 2022-01-30 | 1000000.0 | 49704 | 18741 | 1347 |
| 2022-01-31 | 999999.0 | 55633 | 21088 | 1515 |
Finally, we can create an instance of ODEScenario.
[8]:
snr = cs.ODEScenario(data=subset_df, location_name="Sample", complement=False)
snr.build_with_dynamics(name="Baseline", dynamics=dyn_sample)
# Show summary
snr.summary()
[8]:
| Start | End | Rt | theta | kappa | rho | sigma | alpha1 [-] | 1/alpha2 [day] | 1/beta [day] | 1/gamma [day] | ODE | tau | ||
|---|---|---|---|---|---|---|---|---|---|---|---|---|---|---|
| Scenario | Phase | |||||||||||||
| Baseline | 0th | 2022-01-01 | 2022-01-31 | 2.5 | 0.002 | 0.005 | 0.2 | 0.075 | 0.002 | 200 | 5 | 13 | SIR-F Model | 1440 |
If we need to perform time-series segmentation, tau estimation and ODE parameter estimation, we can use .build_with_model(name=<str>, model=<ODEModel>, data_range=<tuple of (str, str) or None>, tau=<int or None> instead of .build_with_dynamics().
1.3 With serialized ODEScenario object
From version 2.28.0, we can save scenario settings as JSON file using ODEScenario.to_json(filename). The JSON file will be used to re-create ODEScenario object, skipping ODE parameter estimation step and so on.
To JSON file:
[9]:
# Create {"filename": <absolute path>} easily
filer = cs.Filer(directory="input", prefix="jpn")
file_dict = filer.json(title="scenarios")
# To JSON file
json_file = snr.to_json(**file_dict)
From JSON file:
[10]:
snr_recreated = cs.ODEScenario.from_json(json_file)
# Describe (explained later)
snr_recreated.describe()
[10]:
| max(Infected) | argmax(Infected) | Confirmed on 31Jan2022 | Infected on 31Jan2022 | Fatal on 31Jan2022 | |
|---|---|---|---|---|---|
| Baseline | 33030.0 | 2022-01-31 | 55633.0 | 33030.0 | 1515.0 |
Set additional scenarios
We will define the following scenario as an example to analyze the impact of ODE parameter changes, copying the baseline scenario and add a phase with the changed ODE parameter values. Note that this is just an assumption. It will be better to change ODE parameter values for your analysis.
name |
01Jan - 31Jan |
\(\kappa\) (to 30Jun) |
\(\rho\) (to 30Jun) |
\(\sigma\) (to 30Jun) |
|---|---|---|---|---|
Baseline |
100% |
100% |
100% |
100% |
Lockdown |
100% |
100% |
50% |
100% |
Medicine |
100% |
50% |
100% |
200% |
Vaccine |
100% |
60% |
80% |
120% |
Get the baseline values of ODE parameters.
[11]:
df = snr.summary()
kappa, rho, sigma = df.loc[("Baseline", "0th"), ["kappa", "rho", "sigma"]]
print(f"kappa={kappa:.4}, rho={rho:.4}, sigma={sigma:.4}")
kappa=0.005, rho=0.2, sigma=0.075
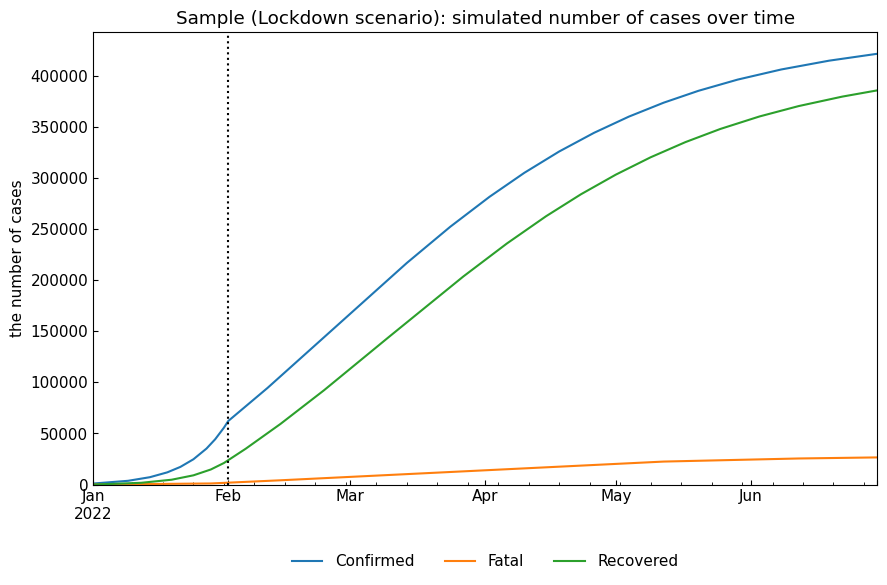
2.1 Lockdown scenario
This scenario assumes that \(\rho\) value will be decreased from 01Feb2022 because of stay-home restriction.
[12]:
name = "Lockdown"
snr.build_with_template(name=name, template="Baseline")
snr.append(name=name, end="30Jun2022", rho=rho*0.5)
# Simulation
snr.simulate(name=name, v="01Feb2022");
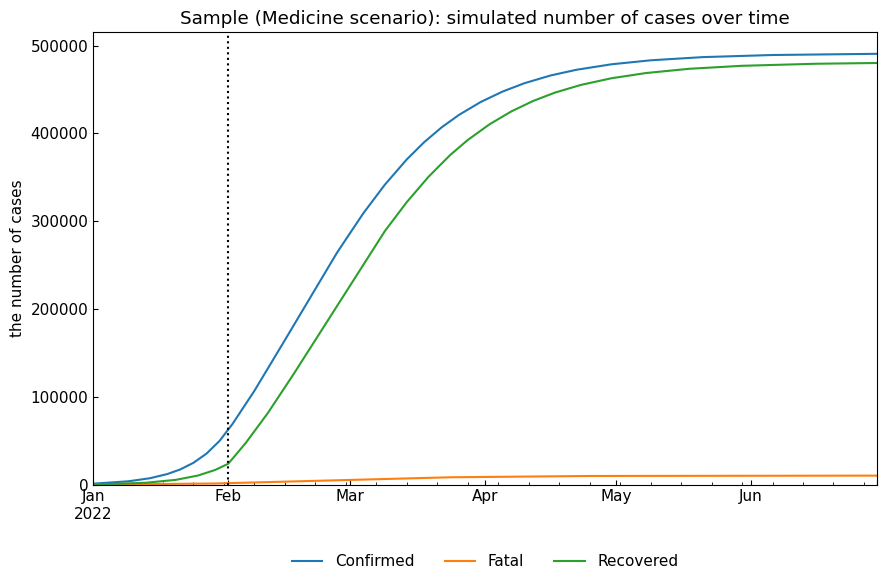
2.2 Medicine scenario
This scenario assumes that \(\kappa\) will be decreased and \(\sigma\) will be increased because of new medicine development.
[13]:
name = "Medicine"
snr.build_with_template(name=name, template="Baseline")
snr.append(name=name, end="30Jun2022", kappa=kappa*0.5, sigma=sigma*2)
# Simulation
snr.simulate(name=name, v="01Feb2022");
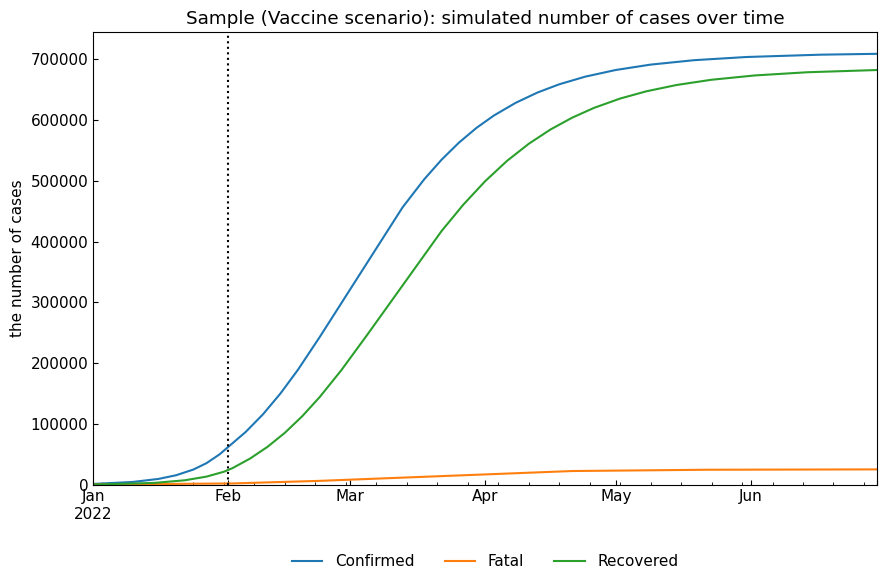
2.3 Vaccine scenario
This scenario assumes that \(\kappa\) and \(\rho\) will be decreased and \(\sigma\) will be increased because of vaccination.
[14]:
name = "Vaccine"
snr.build_with_template(name=name, template="Baseline")
snr.append(name=name, end="30Jun2022", kappa=kappa*0.6, rho=rho*0.8, sigma=sigma*1.2)
# Simulation
snr.simulate(name=name, v="01Feb2022");
2.4 Adjustment of the last dates
The last dates of the new scenarios are 30Jun2022, but the baseline scenario ends on 31Jan2022. We need to extend the last phase to the baseline scenario analysis with ODEScenario().append(name="Baseline") or ODEScenario().append() (useful when we have some unchanged scenarios).
Before appended:
[15]:
snr.summary().style.applymap(lambda x: "background-color: yellow", subset=pd.IndexSlice[("Baseline", "0th"), "End"])
[15]:
| Start | End | Rt | theta | kappa | rho | sigma | alpha1 [-] | 1/alpha2 [day] | 1/beta [day] | 1/gamma [day] | ODE | tau | ||
|---|---|---|---|---|---|---|---|---|---|---|---|---|---|---|
| Scenario | Phase | |||||||||||||
| Baseline | 0th | 2022-01-01 00:00:00 | 2022-01-31 00:00:00 | 2.500000 | 0.002000 | 0.005000 | 0.200000 | 0.075000 | 0.002000 | 200 | 5 | 13 | SIR-F Model | 1440 |
| Lockdown | 0th | 2022-01-01 00:00:00 | 2022-01-31 00:00:00 | 2.500000 | 0.002000 | 0.005000 | 0.200000 | 0.075000 | 0.002000 | 200 | 5 | 13 | SIR-F Model | 1440 |
| 1st | 2022-02-01 00:00:00 | 2022-06-30 00:00:00 | 1.250000 | 0.002000 | 0.005000 | 0.100000 | 0.075000 | 0.002000 | 200 | 10 | 13 | SIR-F Model | 1440 | |
| Medicine | 0th | 2022-01-01 00:00:00 | 2022-01-31 00:00:00 | 2.500000 | 0.002000 | 0.005000 | 0.200000 | 0.075000 | 0.002000 | 200 | 5 | 13 | SIR-F Model | 1440 |
| 1st | 2022-02-01 00:00:00 | 2022-06-30 00:00:00 | 1.310000 | 0.002000 | 0.002500 | 0.200000 | 0.150000 | 0.002000 | 400 | 5 | 7 | SIR-F Model | 1440 | |
| Vaccine | 0th | 2022-01-01 00:00:00 | 2022-01-31 00:00:00 | 2.500000 | 0.002000 | 0.005000 | 0.200000 | 0.075000 | 0.002000 | 200 | 5 | 13 | SIR-F Model | 1440 |
| 1st | 2022-02-01 00:00:00 | 2022-06-30 00:00:00 | 1.720000 | 0.002000 | 0.003000 | 0.160000 | 0.090000 | 0.002000 | 333 | 6 | 11 | SIR-F Model | 1440 |
Append:
[16]:
snr.append().summary().style.applymap(lambda x: "background-color: yellow", subset=pd.IndexSlice[("Baseline", "0th"), "End"])
[16]:
| Start | End | Rt | theta | kappa | rho | sigma | alpha1 [-] | 1/alpha2 [day] | 1/beta [day] | 1/gamma [day] | ODE | tau | ||
|---|---|---|---|---|---|---|---|---|---|---|---|---|---|---|
| Scenario | Phase | |||||||||||||
| Baseline | 0th | 2022-01-01 00:00:00 | 2022-06-30 00:00:00 | 2.500000 | 0.002000 | 0.005000 | 0.200000 | 0.075000 | 0.002000 | 200 | 5 | 13 | SIR-F Model | 1440 |
| Lockdown | 0th | 2022-01-01 00:00:00 | 2022-01-31 00:00:00 | 2.500000 | 0.002000 | 0.005000 | 0.200000 | 0.075000 | 0.002000 | 200 | 5 | 13 | SIR-F Model | 1440 |
| 1st | 2022-02-01 00:00:00 | 2022-06-30 00:00:00 | 1.250000 | 0.002000 | 0.005000 | 0.100000 | 0.075000 | 0.002000 | 200 | 10 | 13 | SIR-F Model | 1440 | |
| Medicine | 0th | 2022-01-01 00:00:00 | 2022-01-31 00:00:00 | 2.500000 | 0.002000 | 0.005000 | 0.200000 | 0.075000 | 0.002000 | 200 | 5 | 13 | SIR-F Model | 1440 |
| 1st | 2022-02-01 00:00:00 | 2022-06-30 00:00:00 | 1.310000 | 0.002000 | 0.002500 | 0.200000 | 0.150000 | 0.002000 | 400 | 5 | 7 | SIR-F Model | 1440 | |
| Vaccine | 0th | 2022-01-01 00:00:00 | 2022-01-31 00:00:00 | 2.500000 | 0.002000 | 0.005000 | 0.200000 | 0.075000 | 0.002000 | 200 | 5 | 13 | SIR-F Model | 1440 |
| 1st | 2022-02-01 00:00:00 | 2022-06-30 00:00:00 | 1.720000 | 0.002000 | 0.003000 | 0.160000 | 0.090000 | 0.002000 | 333 | 6 | 11 | SIR-F Model | 1440 |
If we need all values for dates, we can use ODEScenario().track() method.
[17]:
snr.track()
[17]:
| Scenario | Phase | Rt | theta | kappa | rho | sigma | alpha1 [-] | 1/alpha2 [day] | 1/beta [day] | 1/gamma [day] | ODE | tau | |
|---|---|---|---|---|---|---|---|---|---|---|---|---|---|
| Date | |||||||||||||
| 2022-01-01 | Baseline | 0th | 2.5 | 0.002 | 0.005 | 0.2 | 0.075 | 0.002 | 200 | 5 | 13 | SIR-F Model | 1440 |
| 2022-01-02 | Baseline | 0th | 2.5 | 0.002 | 0.005 | 0.2 | 0.075 | 0.002 | 200 | 5 | 13 | SIR-F Model | 1440 |
| 2022-01-03 | Baseline | 0th | 2.5 | 0.002 | 0.005 | 0.2 | 0.075 | 0.002 | 200 | 5 | 13 | SIR-F Model | 1440 |
| 2022-01-04 | Baseline | 0th | 2.5 | 0.002 | 0.005 | 0.2 | 0.075 | 0.002 | 200 | 5 | 13 | SIR-F Model | 1440 |
| 2022-01-05 | Baseline | 0th | 2.5 | 0.002 | 0.005 | 0.2 | 0.075 | 0.002 | 200 | 5 | 13 | SIR-F Model | 1440 |
| ... | ... | ... | ... | ... | ... | ... | ... | ... | ... | ... | ... | ... | ... |
| 2022-06-26 | Vaccine | 1st | 1.72 | 0.002 | 0.003 | 0.16 | 0.09 | 0.002 | 333 | 6 | 11 | SIR-F Model | 1440 |
| 2022-06-27 | Vaccine | 1st | 1.72 | 0.002 | 0.003 | 0.16 | 0.09 | 0.002 | 333 | 6 | 11 | SIR-F Model | 1440 |
| 2022-06-28 | Vaccine | 1st | 1.72 | 0.002 | 0.003 | 0.16 | 0.09 | 0.002 | 333 | 6 | 11 | SIR-F Model | 1440 |
| 2022-06-29 | Vaccine | 1st | 1.72 | 0.002 | 0.003 | 0.16 | 0.09 | 0.002 | 333 | 6 | 11 | SIR-F Model | 1440 |
| 2022-06-30 | Vaccine | 1st | 1.72 | 0.002 | 0.003 | 0.16 | 0.09 | 0.002 | 333 | 6 | 11 | SIR-F Model | 1440 |
724 rows × 13 columns
3. Compare and evaluate scenarios
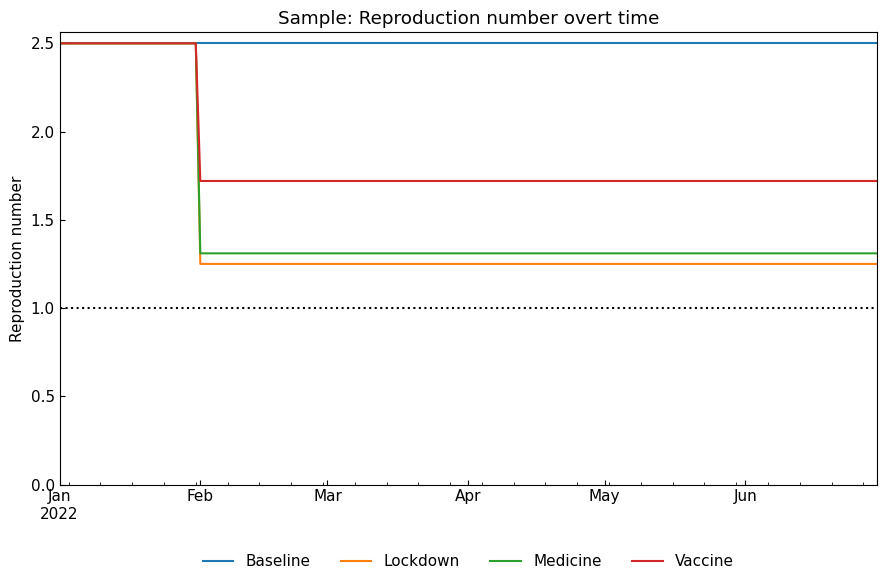
3.1 Compare the params
We will confirm the ODE parameter values and reproduction number with ODEScenario().compare_param(param) method.
Reproduction number:
[18]:
snr.compare_param("Rt");
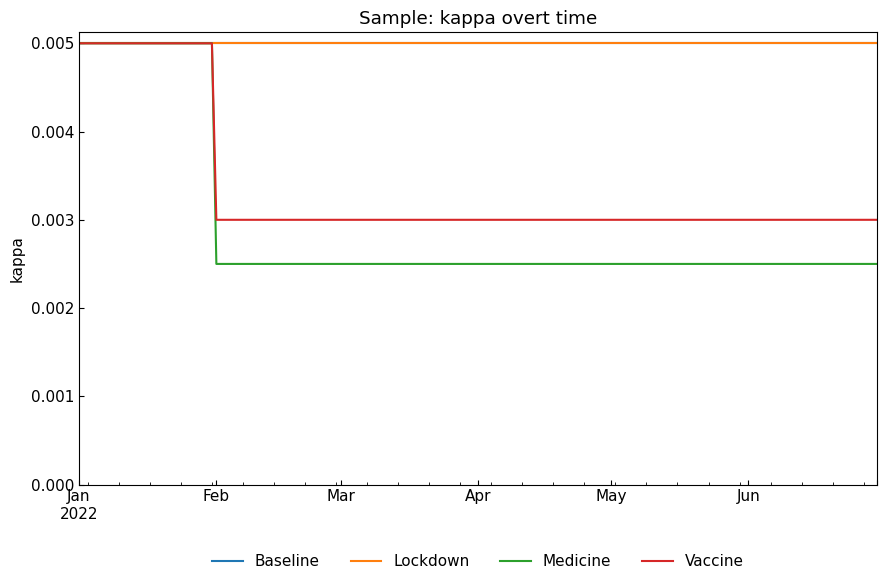
ODE parameter values:
[19]:
snr.compare_param("kappa");
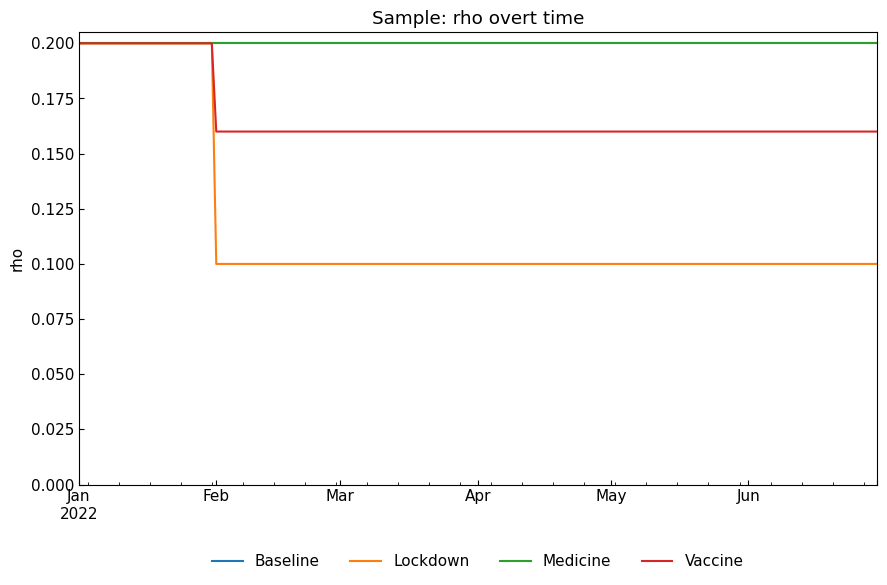
[20]:
snr.compare_param("rho");
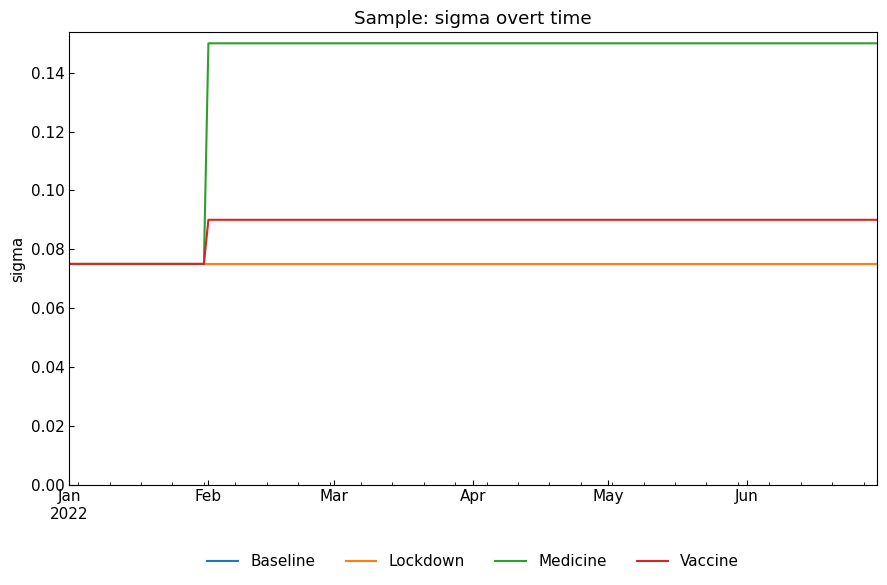
[21]:
snr.compare_param("sigma");
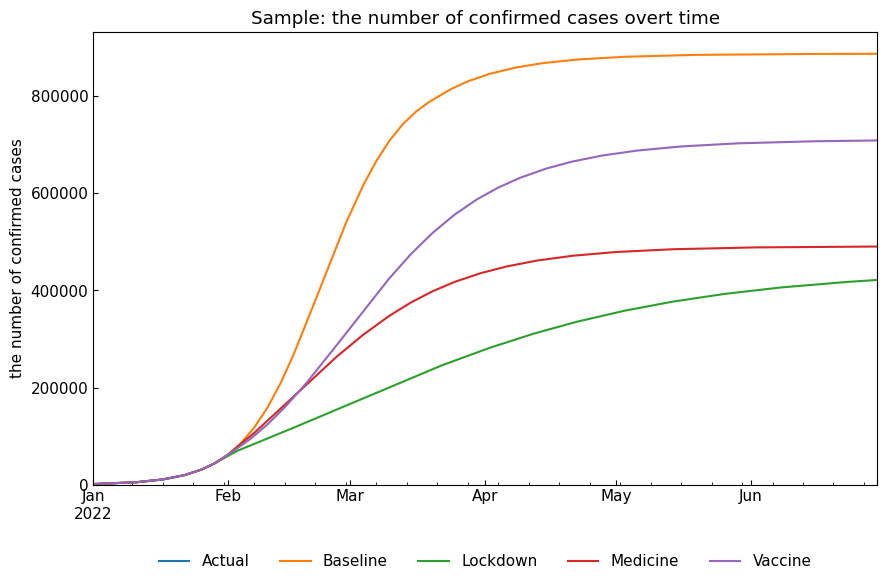
3.2 Compare simulated number of cases
We will compare simulated number of cases with ODEScenario().compare_cases(variable, date_range=<None or tuple of dates>) method.
[22]:
snr.compare_cases("Confirmed");
[23]:
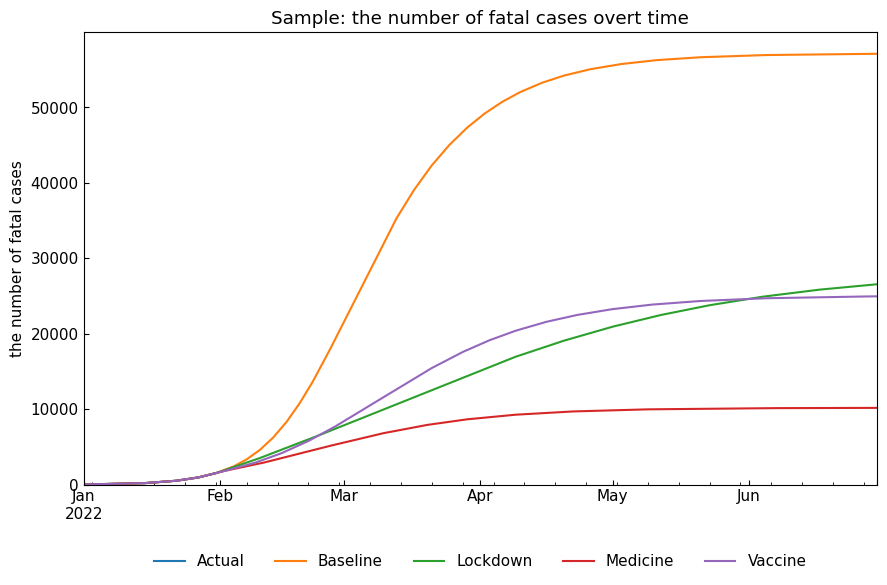
snr.compare_cases("Fatal");
[24]:
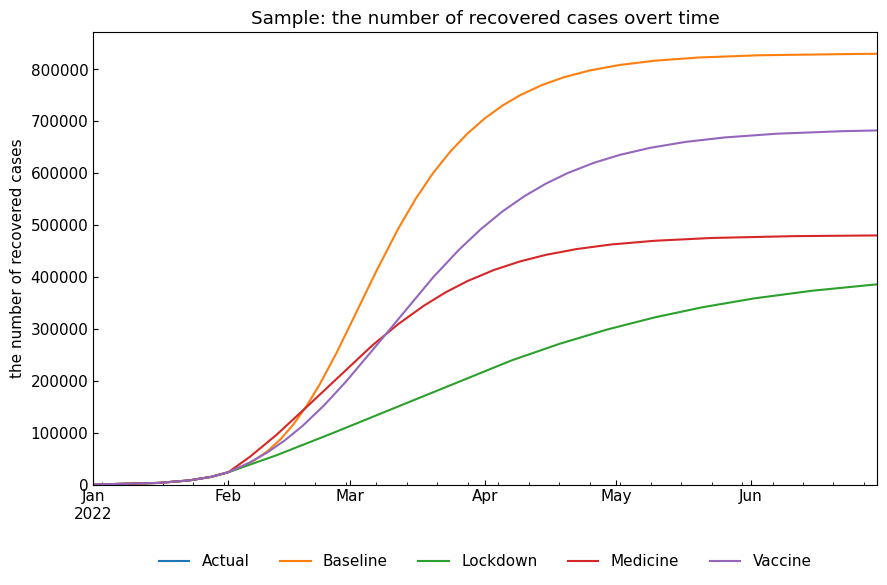
snr.compare_cases("Recovered");
3.3 Describe representative values
We can use ODEScenario.describe() to describe representative values of simulated number of cases. Max value of Infected and the number of cases on the last date will be shown as a pandas.DataFrame. This is useful to confirm the impact of OE parameter changes.
[25]:
snr.describe()
[25]:
| max(Infected) | argmax(Infected) | Confirmed on 30Jun2022 | Infected on 30Jun2022 | Fatal on 30Jun2022 | |
|---|---|---|---|---|---|
| Baseline | 232733.0 | 2022-03-03 | 887821.0 | 574.0 | 57116.0 |
| Lockdown | 47075.0 | 2022-03-09 | 421595.0 | 9267.0 | 26559.0 |
| Medicine | 53834.0 | 2022-02-22 | 490556.0 | 284.0 | 10166.0 |
| Vaccine | 114876.0 | 2022-03-10 | 709162.0 | 1720.0 | 24956.0 |
3.4 Get representative scenario
Which scenario is the best/worst scenario? Specifying quantile, variable name and date, we can confirm that with ODEScenario().represent(q=<float or tuple of float>, variable=<str>, date=<str or None>, included=<list of str or None>, excluded=<list of str or None>). date=None means the last date of scenarios.
[26]:
scenarios = snr.represent(q=(0.1, 0.9), variable="Confirmed", excluded=["Baseline"])
print(f" the best: {scenarios[0]} (small number of confirmed cases)\nthe worst: {scenarios[1]} (large number of confirmed cases)")
 the best: Lockdown (small number of confirmed cases)
the worst: Vaccine (large number of confirmed cases)
We can rename a scenario with ODEScenario().rename(old, new).
[27]:
snr.rename(old=scenarios[0], new="Best")
snr.rename(old=scenarios[1], new="Worst").describe()
[27]:
| max(Infected) | argmax(Infected) | Confirmed on 30Jun2022 | Infected on 30Jun2022 | Fatal on 30Jun2022 | |
|---|---|---|---|---|---|
| Baseline | 232733.0 | 2022-03-03 | 887821.0 | 574.0 | 57116.0 |
| Medicine | 53834.0 | 2022-02-22 | 490556.0 | 284.0 | 10166.0 |
| Best | 47075.0 | 2022-03-09 | 421595.0 | 9267.0 | 26559.0 |
| Worst | 114876.0 | 2022-03-10 | 709162.0 | 1720.0 | 24956.0 |
We can delete a scenario with ODEScenario().delete(pattern, exact=True). Just for demonstration, we will delete the scenario which is not the baseline/best/worst scenario.
[28]:
deleted_scenarios = [name for name in snr.describe().index.unique() if name not in [*scenarios, "Best", "Worst", "Baseline"]]
deleted_scenarios
[28]:
['Medicine']
[29]:
for name in deleted_scenarios:
    snr.delete(name, exact=True)
snr.describe()
[29]:
| max(Infected) | argmax(Infected) | Confirmed on 30Jun2022 | Infected on 30Jun2022 | Fatal on 30Jun2022 | |
|---|---|---|---|---|---|
| Baseline | 232733.0 | 2022-03-03 | 887821.0 | 574.0 | 57116.0 |
| Best | 47075.0 | 2022-03-09 | 421595.0 | 9267.0 | 26559.0 |
| Worst | 114876.0 | 2022-03-10 | 709162.0 | 1720.0 | 24956.0 |
We can delete scenarios with regular expressions with ODEScenario().delete(pattern, exact=True). Just for demonstration, we will add scenarios which names start with “Deleted_”. Then, delete them.
[30]:
snr.build_with_template(name="Deleted_1", template="Baseline")
snr.build_with_template(name="Deleted_2", template="Baseline").describe()
[30]:
| max(Infected) | argmax(Infected) | Confirmed on 30Jun2022 | Infected on 30Jun2022 | Fatal on 30Jun2022 | |
|---|---|---|---|---|---|
| Baseline | 232733.0 | 2022-03-03 | 887821.0 | 574.0 | 57116.0 |
| Best | 47075.0 | 2022-03-09 | 421595.0 | 9267.0 | 26559.0 |
| Worst | 114876.0 | 2022-03-10 | 709162.0 | 1720.0 | 24956.0 |
| Deleted_1 | 232733.0 | 2022-03-03 | 887821.0 | 574.0 | 57116.0 |
| Deleted_2 | 232733.0 | 2022-03-03 | 887821.0 | 574.0 | 57116.0 |
[31]:
snr.delete("Deleted_", exact=False).describe()
[31]:
| max(Infected) | argmax(Infected) | Confirmed on 30Jun2022 | Infected on 30Jun2022 | Fatal on 30Jun2022 | |
|---|---|---|---|---|---|
| Baseline | 232733.0 | 2022-03-03 | 887821.0 | 574.0 | 57116.0 |
| Best | 47075.0 | 2022-03-09 | 421595.0 | 9267.0 | 26559.0 |
| Worst | 114876.0 | 2022-03-10 | 709162.0 | 1720.0 | 24956.0 |
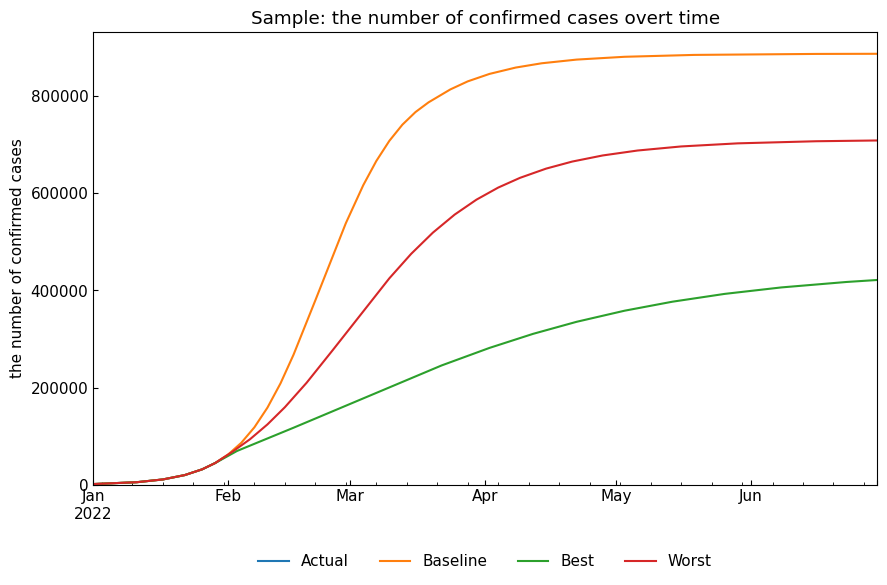
As explained, we can compare the scenarios with the methods, ODEScenario().compare_cases() as an example.
[32]:
snr.compare_cases("Confirmed");
Thank you!